Lab Writeup for Physics
Title:
Centered on paper
Group Members' Names: Include their role in write up
Purpose - Why did you do this lab? What was the major question posed?
Materials and Methods - LIST all materials used. DRAW lab set up. EXPLAIN what measurements were taken and what was graphed.
Results - NEAT data table with UNITS and LABELS. Observations may go here as well. Include any 5-step caluclations or slope/area calcuations as required.
Questions- NUMBERED! Include QUESTION and ANSWER.
Conclusion - Written in Claim, Evidence, Reasoning Format. (CER)
Claim - What conclusion did you draw from the eperiment? (should match your purpose)
Evidence - What data supports this conclusion? (type of graph? slope? area? observations?)
Reasoning - Why the data supports your conclusion.
Error Analysis - % error = (actual-calc)/actual * 100%, sources of error, precision of data
Example:
Joe Smith
Period 3
Aug 25, 2014
The Great Auto Race
Joe Smith - Data gatherer/Purpose
Claire Nguyen - Equipment monitor/Questions
Jon Gonzales - Idea guy/Conclusion
Mary Pesales - Trouble shooter/Methods
Intro: This lab was done to determine the average speed of a car using three different timing methods. - Joe
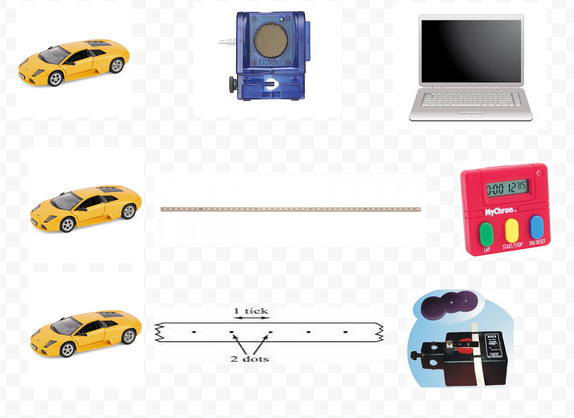
Materials: car, ticker timer, meterstick, stopwatch, motion sensor, computer - Mary

Methods: - Mary
1) A car was timed by placing it in front of a motion sensor and creating a graph in data studio. The distance and time were recorded from the graph between two points.
2) A car was timed with stopwarch as it moved next to a meterstick for 1 m. The time and distance were recorded.
3) A tape was attached to a car and a ticker timer. As the car moved, the tape moved and dots were recorded. The dots were converted to time and recorded, the distance was measured on the tape.
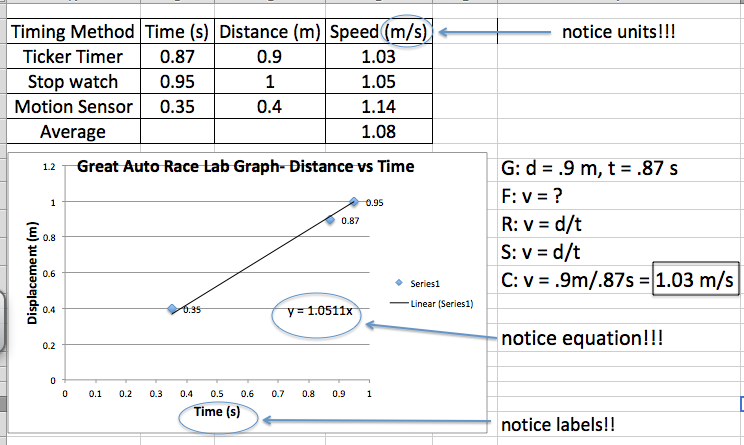
4) The data was graphed and the slope was determined from the best fit line.
Results: - Joe

Questions: - Claire
1) What was the average speed of your car? Our aerage speed was 1.08 m/s according to the data table average and 1.03 m/s according to the graph.
2) What does the slope of your line represent? The slope represents the average speed of the car.
3) Which is more acccurate, 5-step calcuation or slope of graph? The slope of the graph because it averages out the errors.
Conclusion: - Jon
Claim - The average speed of our was most nearly 1.03 m/s
Evidence - The slope of our graph was 1.03 m/s
Reasoning - The slope of our graph is distance/time which is the same as speed.
Error Analysis - There is not % error. Any errors would be due to not measuring distance accurately because of insturmentation limitation with the tape and the meterstick. Our precision was high because all the data gave us similar speeds.